One of my favorite tool in Oracle database performance tuning and performance troubleshooting is ASH or Active Session History. It provides you a near real time monitoring of your database sessions in a nice form. Using the Active Session History you can examine and perform the detailed analysis on the current data in the V$ACTIVE_SESSION_HISTORY.
I have been using ASH since Oracle 10g version and have never looked back. It has grown and evolved a lot but basic principals and value remains the same. It still maintains its unique nature of providing sampled, detailed, non-intrusive activity data. It's always on by default and its licensed as part of the diagnostic pack of Oracle database.
ASH samples 'Active' sessions into memory buffer every second. Yes thats true, every second. Active means non idle sessions. It's written to disk by AWR snapshots and there are 10 second samples in AWR. There are various dimensions in ASH like session, wait events with P1,P2,P3 etc, SQL, PLSQL, Objects and Application. With ASH, it becomes a breeze to do statistical analysis of where time was being spent by many different dimensions. You can answer questions like:
- What events were taking most time?
- What was a session doing?
- What does a SQL statement wait for?
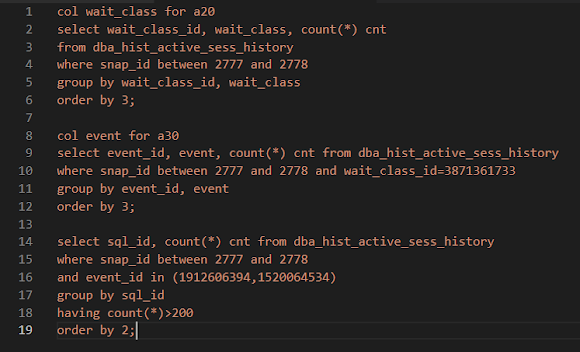
Following are some of my most used queries: